 For traditional hosting, it is typical to display information about how much disk space and bandwidth your sites are using in the control panel.
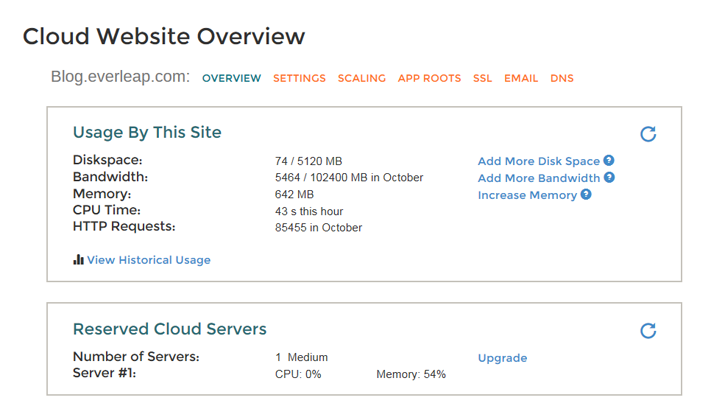
Our control panel provides that data. But we know that customers want more insight into the behavior and health of their web applications. So we now deliver enhanced usage stats including memory usage, CPU usage, HTTP requests and errors.
In the Site Overview section of the control panel, we now display a point-in-time snapshot of the site’s usage stats. You can refresh the data but note that the data updates in our database every 1-2 minutes. Below I took a screenshot from the control panel of this very blog.
(You see, our blog is running on our own platform!) You’ll notice if you run on a Reserved Cloud Server, then we display information regarding the server as well. If you scale out to multiple Reserved Cloud Servers, we would report usage stats on each server.

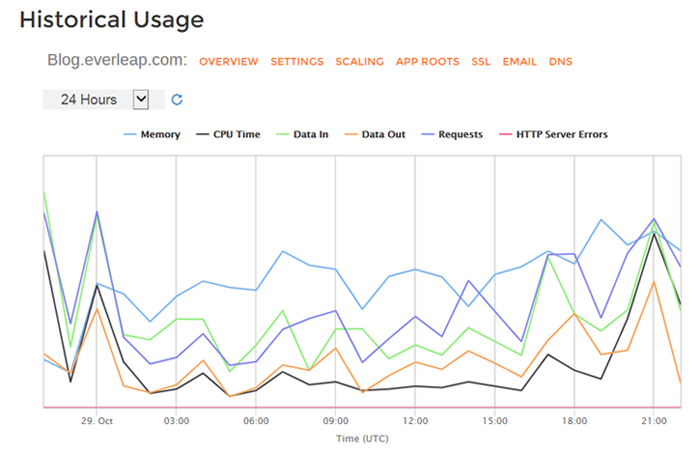
But what’s really cool is that we now provide a chart of historical usage for memory usage, CPU usage, data in, data out, HTTP requests and HTTP server errors. You can select to chart out your data for 6 hours, 24 hours, 7 days and 30 days.
This information should provide you with some good insight into your site traffic and how your site is behaving. Below I took a screenshot from the control panel of the historical usage of this blog over the course of 24 hours.
You can toggle off any of the data items you wish not to view in the plot. Also, below the plot (not shown below), we also display the max/min/average/total information of the site’s usage data.
 We hope that you find this helpful. Enjoy….
No responses yet